

Jan 2019
Coleman Ag
Innovation is key for Oregon's largest hop growing operation
"Agworld is a tremendous resource for our crop teams. The data it provides enables our crop teams to plan thoughtfully and make wiser decisions."
Liz Coleman
Connect your Agworld farm and field data with Power BI to unlock a suite of customisable dashboards, giving you full visibility into costs, production, profitability, and operational performance across your enterprise.
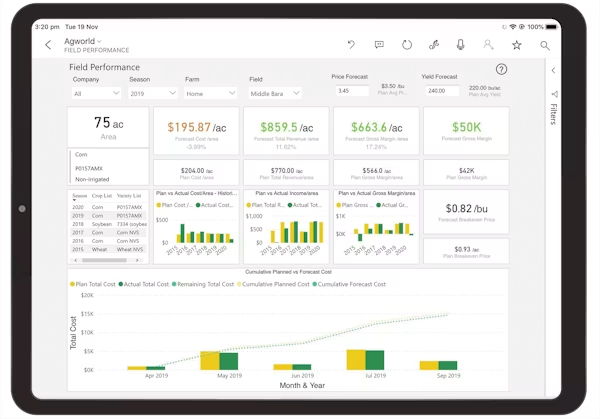
With the Power BI integration, structured agronomic, financial, and operational data from Agworld becomes the backbone of powerful, flexible dashboards. You can use Agworld’s out-of-the-box reports or build your own custom dashboards combining data across farms, fields, seasons and enterprise structure. You can use this data to create historical benchmarks, run in-depth scenario analysis and much more.
Because Agworld stores all data in a structured format, dashboards can deliver real-time insights: monitor crop costs, input usage, gross margins, yield estimates, and compare across seasons or regions.
How do I set up my Agworld – Power BI integration?
Follow these steps:
What data from Agworld will I be able to see in Power BI?
Power BI pulls structured data from Agworld, including (but not limited to):
Why use Power BI instead of Agworld’s built-in reporting?
Agworld’s custom reporting covers many needs, but Power BI gives you unlimited flexibility: you can combine Agworld data with other data sources (e.g. accounting, market prices, external weather or yield data), build advanced visualisations, and create dashboards for different stakeholders (owners, managers, agronomists, lenders).
For larger farming operations, or those needing high-level management reporting, this level of flexibility and customisation can replace multiple spreadsheets and manual reconciliations.
Use Agworld + Power BI to turn data into decisions: fast.
As soon as you record operations or financial data in Agworld, your Power BI dashboards update, giving you a live picture of costs, performance and profitability across your enterprise.
Use Agworld’s default reports, or build your own. Combine cropping, financial, inventory, and external data to answer the questions that matter for your farm.
Forecast seasonal costs and product needs, run “what-if” scenarios (yield, price, input costs), and monitor performance against budgets to manage risk proactively.
Power BI works on desktop, mobile and web, so agronomists, accountants, board members, contractors or partners can all access relevant dashboards and stay aligned.
Coleman Ag
Innovation is key for Oregon's largest hop growing operation
"Agworld is a tremendous resource for our crop teams. The data it provides enables our crop teams to plan thoughtfully and make wiser decisions."
Liz Coleman

Agworld
We are transforming farming into a seamlessly connected ecosystem, where every decision is informed by shared data, collaboration is effortless, and operational clarity drives long-term success.